Workshop – Introduction to Linear Mixed Models (LMMs)

Carine Klauberg, Ph.D.
Research Assistant Scientist / Forest Engineer
Quantitative Forest Ecology, GIS and Artificial Intelligence LAB
Klauberg Lab
Website
School of Forest, Fisheries, and Geomatics Sciences (SFFGS)
Institute of Food & Agricultural Sciences (IFAS) - University of
Florida (UF)
1745 McCarty Drive / 138 Newins-Ziegler Hall
PO Box 110410 Gainesville, FL 32611-0410
Cell: +1 (352) 999-3174
carine.klaubergs@ufl.edu ; carine_klauberg@hotmail.com
2025-09-14
Welcome to the Workshop
This workshop introduces Linear Mixed Models (LMMs)
with a hands-on case study in forestry.
We’ll start from linear models (LMs), highlight their
limitations, and then extend to mixed
models.
Workshop Structure
- Introduction
- Overall and Specific Objective
- Learning Outcomes
- Linear Mixed Effect Models
- Overall and Specific Objective
- Hands-on Example in R
- 2.1 Research Question, Objectives and Hypotheses
- 2.2: Files for This Workshop
- 2.3: Install required libraries
- 2.4: Import and Explore the Data
- 2.5: Fit a Linear Mixed-Effects Model (LMM)
- 2.6: Model Diagnostics
- 2.7: Visualization
- ShinyApp
- Wrap-up
- Evaluation survey
1.Introduction
This is a hands-on workshop for graduate students using R to learn linear mixed-effects models (LMMs). You’ll practice fitting and interpreting LMMs (fixed and random effects), checking assumptions, and communicating results. In addition to coding LMMs in R (e.g., with lme4/lmerTest), the workshop introduces an interactive Shiny app for running models, visualizing diagnostics, and comparing specifications without writing much code.
1.1: Objectives
The overall objective of this workshop is to introduce Linear Mixed-Effects Models (LMMs) for analyzing hierarchical (grouped) data commonly encountered in agriculture, forestry, and ecology.

Specific objectives:
- Identify when LMMs are appropriate and why they improve on ordinary linear models.
- Explore and visualize data to reveal structure, patterns, and potential issues.
- Fit linear mixed-effects models (LMM) in R.
- Evaluate key assumptions (linearity, normality, homoscedasticity, grouping/independence).
- Interpret fixed and random effects and communicate results clearly.
- Generate and visualize predictions at both population and group levels.
1.2: Linear Mixed-Effects Models (LMM)
Linear Mixed-Effects Models (LMMs) extend simple linear models by adding flexibility to handle grouped or hierarchical data. In many agricultural, forestry, and ecological studies, observations are not independent: trees belong to species, plots belong to farms, and animals belong to herds. Ignoring this structure can bias estimates and underestimate variability.
Mixed models address this issue by combining two components:
- Fixed effects: describe the overall relationships
that apply to all observations on average.
- Random effects: capture group-specific variability
(e.g., species, sites, farms), allowing intercepts and slopes to vary
across groups.
This framework makes LMMs especially relevant in UF/IFAS research, where experiments and surveys often involve nested designs such as farms, blocks, or species.
For an observation \(i\) within group \(j\):
\[ y_{ij} = \beta_0 + \beta_1 x_{ij} + b_{0j} + b_{1j}x_{ij} + \epsilon_{ij} \]
where:
- \(y_{ij}\): response for observation
\(i\) in group \(j\).
- \(\beta_0, \beta_1\): fixed effects
(average intercept and slope across all groups).
- \(b_{0j}, b_{1j}\): random effects
(group-specific deviations in intercept and slope), with
\[
b_{0j}, b_{1j} \sim N(0, G)
\]
- \(\epsilon_{ij}\): residual
(within-group unexplained variation), with
\[
\epsilon_{ij} \sim N(0, R)
\]
2: Hands-On Example
For this example, imagine we are working in a common-garden experiment in North Florida, where deciduous and evergreen trees were planted under the same soil, climate, and management conditions. Our research question is: Do evergreen species grow more or less than deciduous species, after accounting for tree height and species-level variation?

2.1 Research Question, Objectives and Hypotheses
Overall Objective:
To demonstrate how Linear Mixed-Effects Models (LMMs) can be used to evaluate growth differences between plant functional types while accounting for hierarchical structure in ecological data.Specific Objectives:
- Explore the dataset visually (EDA).
- Fit a linear mixed-effects model (LMM) with species as a random effect.
- Perform diagnostics to assess model assumptions.
- Interpret fixed effects, random effects, and R².
- Visualize predictions and group-specific differences.
Hypotheses:
H₀ (null): No difference in growth between
deciduous and evergreen species, after accounting for height and
species.
H₁ (alternative): Growth differs between plant functional types, even after accounting for height and species.
2.2: Files for This Workshop
tree_dataset.csv→ Dataset in CSV format (semicolon-delimited), containing tree growth, height, species, and plant functional type.
Download the data: tree_dataset.csvR script
Download the R script: LMM_example.R- Attributes:
growth → tree growth in diameter (mm/year).
height → tree height (m).
pft → plant functional type (deciduous vs evergreen).
sp → species identifier (e.g., sp01, sp02…).
2.3: Install required libraries
# List of required packages

required_packages <- c(
  "lme4",
  "lmerTest",
  "ggplot2",
  "car",
  "performance",
  "viridis",
  "patchwork"
)

# Install any that are missing
installed <- required_packages %in% rownames(installed.packages())
if (any(!installed)) {
  install.packages(required_packages[!installed])
}

# Load all libraries
for (pkg in required_packages) {
  print(pkg)
  library(pkg, character.only = TRUE)
}
required_packages <- c(
"lme4",
"lmerTest",
"ggplot2",
"car",
"performance",
"viridis",
"patchwork"
)
# Install any that are missing
installed <- required_packages %in% rownames(installed.packages())
if (any(!installed)) {
install.packages(required_packages[!installed])
}
# Load all libraries
for (pkg in required_packages) {
print(pkg)
library(pkg, character.only = TRUE)
}## [1] "lme4"
## [1] "lmerTest"
## [1] "ggplot2"
## [1] "car"
## [1] "performance"
## [1] "viridis"
## [1] "patchwork"2.4: Import and Explore the Data
# Read the dataset from a CSV file
# sep = ";"   → because the file is semicolon-delimited
# header = TRUE → first row contains column names
dataset <- read.table("Z:\\06_Carine\\04_Statistics\\05_Workshop\\script_R\\tree_dataset.csv", sep = ";", header = TRUE)


# Show the first 6 rows of the dataset to check structure
head(dataset)
## growth sp pft height
## 1 0.6418726 sp01 deciduous 14.14
## 2 0.7516172 sp01 deciduous 17.53
## 3 1.0683803 sp01 deciduous 25.66
## 4 0.8559022 sp01 deciduous 18.63
## 5 0.9978498 sp01 deciduous 23.33
## 6 0.9342241 sp01 deciduous 21.34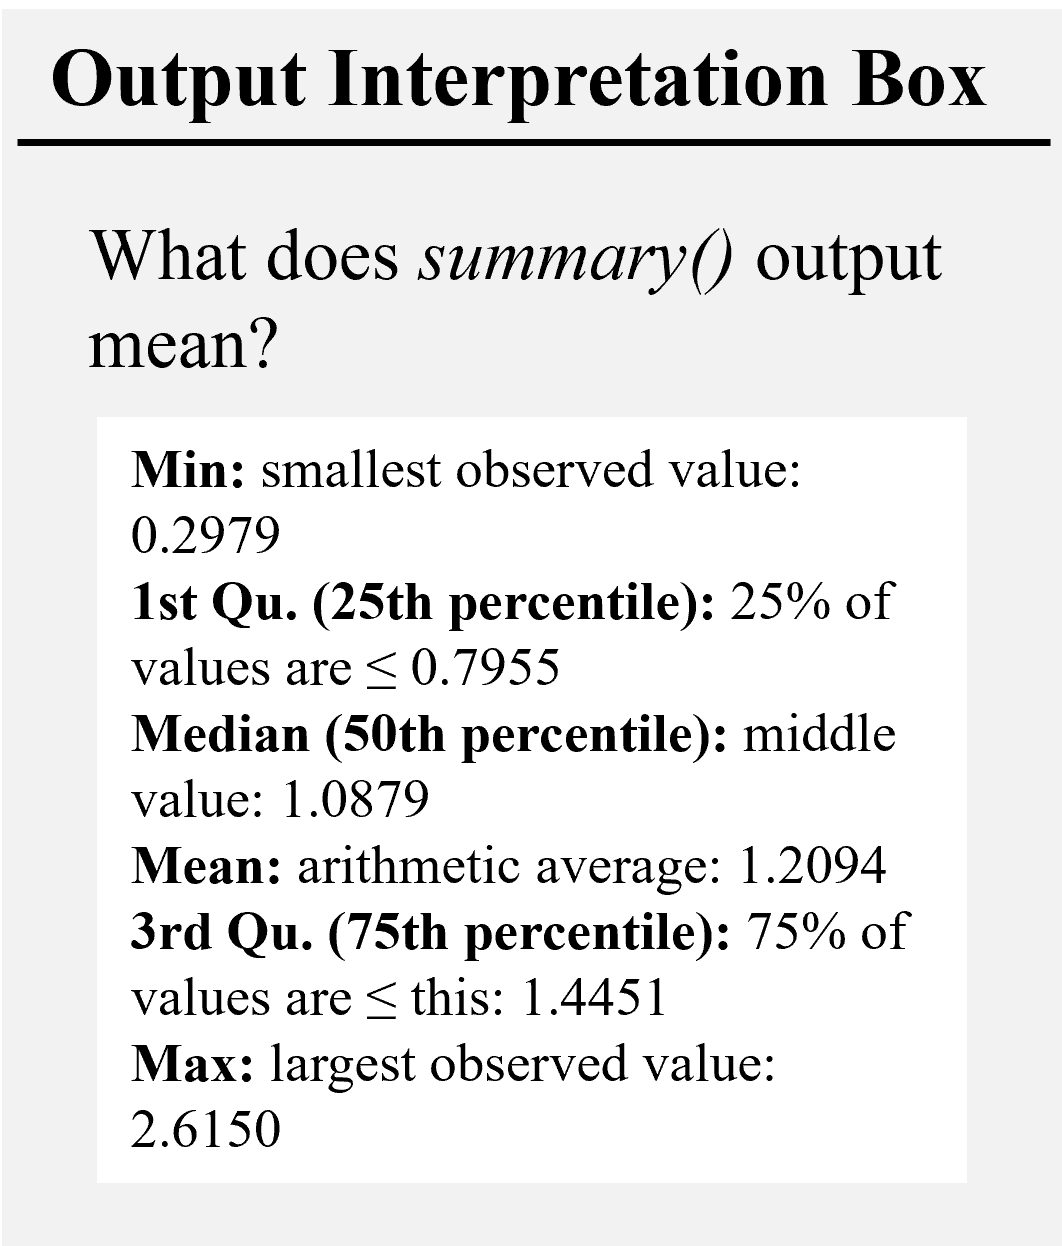
# List all unique species codes in the dataset
unique(dataset$sp)
## [1] "sp01" "sp02" "sp03" "sp04" "sp05" "sp06" "sp07" "sp08" "sp09" "sp10"# List the unique plant functional types (deciduous vs evergreen)
unique(dataset$pft)## [1] "deciduous" "evergreen"# Summary statistics of tree growth and height (min, median, mean, max, quartiles)
summary(dataset)## growth sp pft height
## Min. :0.2979 Length:100 Length:100 Min. :10.18
## 1st Qu.:0.7955 Class :character Class :character 1st Qu.:13.53
## Median :1.0879 Mode :character Mode :character Median :16.76
## Mean :1.2094 Mean :17.46
## 3rd Qu.:1.4451 3rd Qu.:21.49
## Max. :2.6150 Max. :25.83# Exploratory Plots
# Boxplot: Tree growth by plant functional type (PFT)
# Boxes are filled with green (evergreen) and brown (deciduous)
p1 <- ggplot(dataset, aes(x = pft, y = growth, fill = pft)) +
geom_boxplot(alpha = 0.8, color = "black") + # black outline, colored fill
scale_fill_manual(values = c("evergreen" = "darkgreen",
"deciduous" = "saddlebrown")) + # custom colors
theme_minimal() + # clean minimal theme
labs(title = "a) Tree Growth by Plant Functional Type", # plot title
x = "Plant Functional Type (PFT)", # x-axis label
y = "Growth (mm/year)") # y-axis label
# Boxplot: Distribution of growth by species
# Boxes are filled by plant functional type (pft)
p2<-ggplot(dataset, aes(x = sp, y = growth, fill = pft)) +
geom_boxplot() + # draw boxplots
scale_fill_manual(values = c("evergreen" = "darkgreen",
"deciduous" = "saddlebrown")) + # custom colors
theme_minimal() + # clean minimal theme
labs(title = "d) Tree Growth Distribution by Species", # plot title
x = "Species", y = "Growth (mm/year)") # axis labels
# Scatterplot: Tree growth vs. height
# Points are colored by plant functional type (pft)
p3<-ggplot(dataset, aes(x = height, y = growth, color = pft)) +
geom_point(size = 2, alpha = 0.7) + # add points (semi-transparent)
scale_color_manual(values = c("evergreen" = "darkgreen",
"deciduous" = "saddlebrown")) + # custom colors
theme_minimal() + # clean minimal theme
labs(title = "c) Tree Growth by Height", # plot title
x = "Height (m)", y = "Growth (mm/year)") # axis labels
# Scatterplot: Tree growth vs. height
# Points are colored by species type (sp)
p4 <- ggplot(dataset, aes(x = height, y = growth, color = sp)) +
geom_point(size = 2, alpha = 0.7) + # species points
theme_minimal() +
labs(title = "d) Tree Growth by Height (by Species)", # title
x = "Height (m)", y = "Growth (mm/year)", # axis labels
color = "Species") # legend title
# Combine diagnostic plots in a 2x2 grid
(p1 | p2) / (p3 | p4) #
- From the boxplots (a, b), which PFT appears to grow faster?
- In panel (c), what is the overall relationship between height and growth?
- In panel (c), do all species show the same height–growth pattern, or does it vary by species?
2.5: Fit a Linear Mixed-Effects Model (LMM)
#################################################################
# Step 1: Full mixed model (random slope + intercept for species)
#################################################################


# --------------------------------------------------------------
# Fixed effects:
#   - height (continuous predictor of growth, in meters)
#   - pft (plant functional type: deciduous vs evergreen)
#   - height:pft interaction (tests whether the slope of growth vs. height
#     differs between deciduous and evergreen species)
#
# Random effects:
#   - (height | sp): allows each species (sp) to have:
#       * its own intercept (baseline growth)
#       * its own slope with respect to height
#   This structure captures both baseline differences among species
#   and species-specific responses to tree height.
#
# Model formula:
lmm_full <- lmer(growth ~ height + pft + height:pft + (height | sp), data = dataset)
summary(lmm_full)
# --------------------------------------------------------------
# Fixed effects:
# - height (continuous predictor of growth, in meters)
# - pft (plant functional type: deciduous vs evergreen)
# - height:pft interaction (tests whether the slope of growth vs. height
# differs between deciduous and evergreen species)
#
# Random effects:
# - (height | sp): allows each species (sp) to have:
# * its own intercept (baseline growth)
# * its own slope with respect to height
# This structure captures both baseline differences among species
# and species-specific responses to tree height.
#
# Model formula:
lmm_full <- lmer(growth ~ height + pft + height:pft + (height | sp), data = dataset)
summary(lmm_full)## Linear mixed model fit by REML. t-tests use Satterthwaite's method ['lmerModLmerTest']
## Formula: growth ~ height + pft + height:pft + (height | sp)
## Data: dataset
 ##
## REML criterion at convergence: -121.2
##
## Scaled residuals:
## Min 1Q Median 3Q Max
## -2.59205 -0.57506 0.00258 0.62308 3.01476
##
## Random effects:
## Groups Name Variance Std.Dev. Corr
## sp (Intercept) 0.0409523 0.20237
## height 0.0006224 0.02495 0.03
## Residual 0.0073655 0.08582
## Number of obs: 100, groups: sp, 10
##
## Fixed effects:
## Estimate Std. Error df t value Pr(>|t|)
## (Intercept) 0.11721 0.10767 8.37205 1.089 0.30666
## height 0.05699 0.01166 8.35778 4.886 0.00107 **
## pftevergreen 0.37304 0.14890 7.82085 2.505 0.03728 *
## height:pftevergreen -0.01109 0.01636 8.12116 -0.678 0.51669
## ---
## Signif. codes: 0 '***' 0.001 '**' 0.01 '*' 0.05 '.' 0.1 ' ' 1
##
## Correlation of Fixed Effects:
## (Intr) height pftvrg
## height -0.130
## pftevergren -0.723 0.094
## hght:pftvrg 0.093 -0.713 -0.107
# --------------------------------------------------------------
# Notes on fixed effects coding:
# --------------------------------------------------------------
# Factor coding (treatment/dummy):
# - R encodes factors with dummy variables; the first level (alphabetical by default) is the reference.
# - Here, pft has two levels: "deciduous" (reference) and "evergreen".
# - "pftevergreen" = difference for evergreen relative to deciduous.
# Coefficient interpretation for:
# growth ~ height + pft + height:pft + (height | sp)
# - (Intercept): expected growth for deciduous at height = 0 (baseline; note this may be extrapolative).
# - height: slope of growth vs. height for deciduous.
# - pftevergreen: intercept shift (evergreen − deciduous).
# - height:pftevergreen: slope shift (evergreen − deciduous).
# Fitted values (REML):
# - (Intercept) = 0.117
# - height = +0.05699 (p = 0.0011)
# - pftevergreen = +0.37304 (p = 0.037)
# - height:pftevergreen = −0.01109 (p = 0.517)
# Fitted lines:
# - Deciduous: y = 0.11721 + 0.05699 * height
# - Evergreen: y = (0.11721 + 0.37304) + (0.05699 − 0.01109) * height
# ≈ 0.49025 + 0.04590 * height
##
## REML criterion at convergence: -121.2
##
## Scaled residuals:
## Min 1Q Median 3Q Max
## -2.59205 -0.57506 0.00258 0.62308 3.01476
##
## Random effects:
## Groups Name Variance Std.Dev. Corr
## sp (Intercept) 0.0409523 0.20237
## height 0.0006224 0.02495 0.03
## Residual 0.0073655 0.08582
## Number of obs: 100, groups: sp, 10
##
## Fixed effects:
## Estimate Std. Error df t value Pr(>|t|)
## (Intercept) 0.11721 0.10767 8.37205 1.089 0.30666
## height 0.05699 0.01166 8.35778 4.886 0.00107 **
## pftevergreen 0.37304 0.14890 7.82085 2.505 0.03728 *
## height:pftevergreen -0.01109 0.01636 8.12116 -0.678 0.51669
## ---
## Signif. codes: 0 '***' 0.001 '**' 0.01 '*' 0.05 '.' 0.1 ' ' 1
##
## Correlation of Fixed Effects:
## (Intr) height pftvrg
## height -0.130
## pftevergren -0.723 0.094
## hght:pftvrg 0.093 -0.713 -0.107
# --------------------------------------------------------------
# Notes on fixed effects coding:
# --------------------------------------------------------------
# Factor coding (treatment/dummy):
# - R encodes factors with dummy variables; the first level (alphabetical by default) is the reference.
# - Here, pft has two levels: "deciduous" (reference) and "evergreen".
# - "pftevergreen" = difference for evergreen relative to deciduous.
# Coefficient interpretation for:
# growth ~ height + pft + height:pft + (height | sp)
# - (Intercept): expected growth for deciduous at height = 0 (baseline; note this may be extrapolative).
# - height: slope of growth vs. height for deciduous.
# - pftevergreen: intercept shift (evergreen − deciduous).
# - height:pftevergreen: slope shift (evergreen − deciduous).
# Fitted values (REML):
# - (Intercept) = 0.117
# - height = +0.05699 (p = 0.0011)
# - pftevergreen = +0.37304 (p = 0.037)
# - height:pftevergreen = −0.01109 (p = 0.517)
# Fitted lines:
# - Deciduous: y = 0.11721 + 0.05699 * height
# - Evergreen: y = (0.11721 + 0.37304) + (0.05699 − 0.01109) * height
# ≈ 0.49025 + 0.04590 * height
What are the fixed and random effects in the equation below, and how do we interpret them?
\[ \text{Growth}_{ij} = \beta_0 + \beta_1 \cdot \text{Height}_{ij} + \beta_2 \cdot \text{PFT}_j + \beta_3 \cdot (\text{Height}_{ij} \times \text{PFT}_j) + b_{0j} + b_{1j}\text{Height}_{ij} + \epsilon_{ij} \]
- Fixed effects (β0, β1, β2, β3): population-level effects common to all species.
- Random effects (by species
sp) (b0j, b1j): species-specific deviations (random intercept and random slope for height). - Residual (εij): within-species unexplained error for individual trees.
- (Intercept) β0: baseline expected growth for the reference PFT when height = 0.
- height β1: change in growth per unit height for the reference PFT (slope).
- pftevergreen β2: shift in baseline growth for evergreen vs. the reference PFT (difference at height = 0).
- height:pftevergreen β3: change in the height–growth slope for evergreen vs. the reference PFT.
pftis dummy-coded: the first level (alphabetical) is the reference (here, “deciduous”); “pftevergreen” compares evergreen to that reference.
#################################################################
# Step 2: Random intercept model (simpler random structure)
#################################################################

# Fixed effects:
#   - height (continuous predictor of growth)
#   - pft (plant functional type: deciduous vs evergreen)
#   - height:pft interaction (does the effect of height differ by PFT?)
# Random effects:
#   - (1 | sp): only the intercept varies by species,
#     meaning species differ in baseline growth but share the same slope.
# Notes:
#   This is simpler than the random slope model, because it assumes
#   all species respond to height in the same way (parallel lines),
#   but they may start from different baseline levels of growth.
lmm_ri <- lmer(growth ~ height + pft + height:pft + (1 | sp), data = dataset)   # fit LMM with random intercept only
summary(lmm_ri)                                                    # show summary of fixed + random effects
## Linear mixed model fit by REML. t-tests use Satterthwaite's method ['lmerModLmerTest']
## Formula: growth ~ height + pft + height:pft + (1 | sp)
## Data: dataset
##
## REML criterion at convergence: -52.3
##
## Scaled residuals:
## Min 1Q Median 3Q Max
## -3.9139 -0.5964 0.0008 0.5473 2.2598
##
## Random effects:
## Groups Name Variance Std.Dev.
## sp (Intercept) 0.24249 0.4924
## Residual 0.01803 0.1343
## Number of obs: 100, groups: sp, 10
##
## Fixed effects:
## Estimate Std. Error df t value Pr(>|t|)
## (Intercept) 0.123663 0.234932 10.186083 0.526 0.6099
## height 0.057576 0.004610 88.260450 12.489 <2e-16 ***
## pftevergreen 0.385739 0.330776 10.011122 1.166 0.2706
## height:pftevergreen -0.012718 0.006202 88.167459 -2.051 0.0433 *
## ---
## Signif. codes: 0 '***' 0.001 '**' 0.01 '*' 0.05 '.' 0.1 ' ' 1
##
## Correlation of Fixed Effects:
## (Intr) height pftvrg
## height -0.339
## pftevergren -0.710 0.241
## hght:pftvrg 0.252 -0.743 -0.327# Compare random slope vs random intercept
anova(lmm_full, lmm_ri, refit = FALSE) # likelihood ratio test: slope vs intercept## Data: dataset
## Models:
## lmm_ri: growth ~ height + pft + height:pft + (1 | sp)
## lmm_full: growth ~ height + pft + height:pft + (height | sp)
## npar AIC BIC logLik deviance Chisq Df Pr(>Chisq)
## lmm_ri 6 -40.302 -24.671 26.151 -52.302
## lmm_full 8 -105.239 -84.398 60.619 -121.239 68.937 2 1.073e-15 ***
## ---
## Signif. codes: 0 '***' 0.001 '**' 0.01 '*' 0.05 '.' 0.1 ' ' 1
## If p < 0.05 → keep random slopes
## If p > 0.05 → random intercept is sufficient#################################################################
# Step 3: Remove interaction (height:pft)
#################################################################
lmm_no_interaction <- lmer(growth ~ height + pft + (height | sp), data = dataset) # drop interaction term
anova(lmm_full, lmm_no_interaction) # test if interaction is significant## Data: dataset
## Models:
## lmm_no_interaction: growth ~ height + pft + (height | sp)
## lmm_full: growth ~ height + pft + height:pft + (height | sp)
## npar AIC BIC logLik deviance Chisq Df Pr(>Chisq)
## lmm_no_interaction 7 -126.69 -108.46 70.346 -140.69
## lmm_full 8 -125.21 -104.37 70.605 -141.21 0.5173 1 0.472
## If p > 0.05 → interaction not needed, keep simpler model#################################################################
# Step 4: Remove plant functional type effect (pft)
#################################################################
lmm_no_pft <- lmer(growth ~ height + (height | sp), data = dataset) # drop pft (evergreen/deciduous) effect
anova(lmm_no_pft, lmm_no_interaction) # compare with model including pft## Data: dataset
## Models:
## lmm_no_pft: growth ~ height + (height | sp)
## lmm_no_interaction: growth ~ height + pft + (height | sp)
## npar AIC BIC logLik deviance Chisq Df Pr(>Chisq)
## lmm_no_pft 6 -123.11 -107.47 67.553 -135.11
## lmm_no_interaction 7 -126.69 -108.46 70.346 -140.69 5.5863 1 0.0181 *
## ---
## Signif. codes: 0 '***' 0.001 '**' 0.01 '*' 0.05 '.' 0.1 ' ' 1
## If p < 0.05 → pft effect matters, keep in model#################################################################
# Step 5: Remove height effect
#################################################################
lmm_no_height <- lmer(growth ~ pft + (height | sp), data = dataset) # drop height effect
anova(lmm_no_interaction, lmm_no_height) # compare with model including height## Data: dataset
## Models:
## lmm_no_height: growth ~ pft + (height | sp)
## lmm_no_interaction: growth ~ height + pft + (height | sp)
## npar AIC BIC logLik deviance Chisq Df Pr(>Chisq)
## lmm_no_height 6 -111.43 -95.798 61.715 -123.43
## lmm_no_interaction 7 -126.69 -108.456 70.346 -140.69 17.263 1 3.254e-05 ***
## ---
## Signif. codes: 0 '***' 0.001 '**' 0.01 '*' 0.05 '.' 0.1 ' ' 1
# If p < 0.05 → height matters, keep in model
#################################################################
# Final chosen model
#################################################################
final_model <- lmm_no_interaction # assign the selected best model
summary(final_model) # show results (coefficients, SE, p-values)## Linear mixed model fit by REML. t-tests use Satterthwaite's method ['lmerModLmerTest']
## Formula: growth ~ height + pft + (height | sp)
## Data: dataset
##
## REML criterion at convergence: -127.2
##
## Scaled residuals:
## Min 1Q Median 3Q Max
## -2.5742 -0.5519 0.0201 0.6350 3.0028
##
## Random effects:
## Groups Name Variance Std.Dev. Corr
## sp (Intercept) 0.0399444 0.19986
## height 0.0005846 0.02418 0.04
## Residual 0.0073747 0.08588
## Number of obs: 100, groups: sp, 10
##
## Fixed effects:
## Estimate Std. Error df t value Pr(>|t|)
## (Intercept) 0.124179 0.106269 8.454012 1.169 0.274486
## height 0.051339 0.007946 9.177103 6.461 0.000107 ***
## pftevergreen 0.362315 0.146754 7.841833 2.469 0.039356 *
## ---
## Signif. codes: 0 '***' 0.001 '**' 0.01 '*' 0.05 '.' 0.1 ' ' 1
##
## Correlation of Fixed Effects:
## (Intr) height
## height -0.089
## pftevergren -0.721 0.026fixef(final_model) # extract fixed effects only## (Intercept) height pftevergreen
## 0.1241793 0.0513392 0.3623146# Interpretation of fixed effects:
#
# Intercept (0.124)
# This is the baseline growth rate (in mm/year) for the reference group (deciduous species) when tree height = 0.
# (Of course, height = 0 is not realistic, but it anchors the model.)
#
# height (0.0513)
# For every 1 meter increase in tree height, tree growth increases by about 0.051 mm/year (on average, across species).
# This slope applies to both deciduous and evergreen species.
#
# pftevergreen (0.3623)
# Evergreen species grow, on average, 0.36 mm/year more than deciduous species (the reference group), after accounting for tree height.
# This shows the functional type effect.
#
# So, the model equation can be written as:
#
# Deciduous species:
# Growth = 0.124 + 0.051 × Height
#
# Evergreen species:
# Growth = (0.124 + 0.362) + 0.051 × Height
# Growth = 0.486 + 0.051 × Heightranef(final_model) # extract random effects only## $sp
## (Intercept) height
## sp01 -0.01564030 -0.012968867
## sp02 0.02179330 0.023128275
## sp03 0.07673630 0.039909255
## sp04 0.14020490 -0.017147029
## sp05 -0.21427916 -0.007292709
## sp06 0.08649606 0.036282413
## sp07 -0.11122789 -0.017932154
## sp08 0.24076283 -0.019122809
## sp09 -0.29214778 -0.012231066
## sp10 0.06730175 -0.012625309
## with conditional variances for “sp”
# Interpretation of species-level random effects:
# Each row shows species-specific deviations (BLUPs) from the population fixed effects:
#   (Intercept): -> how the baseline (at Height = 0) for species s differs from the global intercept
#   height    :  -> how the Height slope for species s differs from the global height slope
# Positive values = above-average (higher intercept or steeper slope); negative = below-average.
# If your model includes pftevergreen as a fixed effect, it shifts the INTERCEPT only (no pft:height term),
# so random slope differences are unrelated to PFT unless you add that interaction.
# Quick read of the output:
# sp01:  intercept -0.0156 (slightly lower baseline), slope -0.0130 (slightly flatter than average)
# sp02:  intercept +0.0218 (slightly higher baseline), slope +0.0231 (steeper than average)
# sp03:  intercept +0.0767 (higher baseline),        slope +0.0399 (notably steeper than average)
# sp04:  intercept +0.1402 (higher baseline),        slope -0.0171 (somewhat flatter)
# sp05:  intercept -0.2143 (much lower baseline),    slope -0.0073 (slightly flatter)
# sp06:  intercept +0.0865 (higher baseline),        slope +0.0363 (steeper than average)
# sp07:  intercept -0.1112 (lower baseline),         slope -0.0179 (flatter)
# sp08:  intercept +0.2408 (highest baseline),       slope -0.0191 (flatter; height effect reduced)
# sp09:  intercept -0.2921 (lowest baseline),        slope -0.0122 (slightly flatter)
# sp10:  intercept +0.0673 (slightly higher),        slope -0.0126 (slightly flatter)
2.6: Model Diagnostics
###############################################################
# 4) Model Diagnostics
###############################################################

# Extract residuals (observed - fitted values)
res <- resid(final_model)

# --------------------------------------------------------------
# Shapiro-Wilk normality test
# --------------------------------------------------------------
# Tests whether residuals are normally distributed.
# Hypotheses:
# H0: Residuals follow a normal distribution.
# H1: Residuals deviate from normality.
# If p > 0.05 → assumption of normality is satisfied.
shapiro.test(res)
##
## Shapiro-Wilk normality test
##
## data: res
## W = 0.99304, p-value = 0.8905# --------------------------------------------------------------
# Levene’s test for homogeneity of variance
# --------------------------------------------------------------
# Tests if residual variance is equal across groups (here, PFT).
# Hypotheses:
# H0: Variances are equal across groups (homoscedasticity).
# H1: Variances differ between groups (heteroscedasticity).
# If p > 0.05 → assumption of homogeneity is satisfied.
leveneTest(res ~ as.factor(dataset$pft))## Levene's Test for Homogeneity of Variance (center = median)
## Df F value Pr(>F)
## group 1 2.7352 0.1014
## 98# --------------------------------------------------------------
# R² for mixed model
# --------------------------------------------------------------
# Computes marginal and conditional R² values.
# - Marginal R² = variance explained by fixed effects only.
# - Conditional R² = variance explained by both fixed + random effects.
r2(final_model)## # R2 for Mixed Models
##
## Conditional R2: 0.978
## Marginal R2: 0.275# --------------------------------------------------------------
# Prepare data for plots
# --------------------------------------------------------------
# Build a data frame with fitted values and residuals for visualization.
residual_df <- data.frame(Fitted = fitted(final_model), Residuals = res)
# --------------------------------------------------------------
# Residuals vs Fitted Plot
# --------------------------------------------------------------
# Purpose: check for systematic patterns in residuals.
# - Ideally: residuals form a random "cloud" around 0 with no trend.
# - Patterns (curves, funnels) may indicate non-linearity or heteroscedasticity.
p5 <- ggplot(residual_df, aes(x = Fitted, y = Residuals, color = abs(Residuals))) + # x = fitted values, y = residuals, color by residual magnitude
geom_point(size = 2, alpha = 0.8) + # scatterplot of residuals (semi-transparent points)
geom_hline(yintercept = 0, linetype = "dashed", color = "black") + # dashed reference line at 0 (ideal mean of residuals)
scale_color_viridis(option = "C", direction = 1) + # viridis scale: blue = small residuals, yellow = large
theme_minimal() + # clean background
labs(title = "a) Residuals vs Fitted", # plot title
x = "Fitted Values [Growth (mm/year)]", # x-axis = predicted growth
y = "Residuals [Growth (mm/year)]", # y-axis = observed - predicted
color = "|Residuals|") # legend explains color = |residuals|
# --------------------------------------------------------------
# Histogram of Residuals with Normal Curve
# --------------------------------------------------------------
# Purpose: check approximate normality of residuals.
# - A bell-shaped histogram suggests residuals are close to normal.
# - Skewed or multi-modal shapes indicate potential violations.
p6 <- ggplot(residual_df, aes(x = Residuals)) +
geom_histogram(aes(y = after_stat(density), fill = after_stat(x)), # histogram of residuals (scaled to density)
bins = 20, color = "white", alpha = 0.9) + # 20 bins, white borders, semi-transparent fill
stat_function(fun = dnorm, # overlay theoretical normal density curve
args = list(mean = mean(res), sd = sd(res)), # parameters: mean and sd of residuals
aes(color = "Theoretical Normal"), # label for legend
linewidth = 1, linetype = "dashed") + # dashed black curve
scale_color_manual(name = "Distribution", # legend for curve
values = c("Theoretical Normal" = "black")) + # black dashed line
scale_fill_viridis(option = "C", direction = 1) + # viridis color scale for residuals
theme_minimal() + # clean background
labs(title = "b) Histogram of Residuals with Normal Curve", # plot title
x = "Residuals [Growth (mm/year)]", # x-axis label
y = "Density", # y-axis label
fill = "Residuals") # legend for histogram fill
# --------------------------------------------------------------
# Combine diagnostic plots side by side
# --------------------------------------------------------------
(p5 | p6)
- Shapiro–Wilk test: Are residuals normal?
- Levene’s test: Equal variance across PFTs?
- R²: How much variance is explained by fixed vs random effects?
2.7:Visualization of models
# Predictions from the final model
dataset$pred_full  <- predict(final_model)              # predictions with fixed + random effects (species-specific)
dataset$pred_fixed <- predict(final_model, re.form=NA)  # predictions with fixed effects only (ignores species variation)

p4<-ggplot() +
  geom_point(data = dataset,                            # plot observed values
             aes(x = height, y = growth, color = sp),   # x = height, y = growth, color = species
             size = 2, alpha = 0.7) +                   # semi-transparent points

  geom_line(data = dataset,                             # plot mixed-effects predictions
            aes(x = height, y = pred_full, group = sp,  # predictions vary by species (grouped)
                color = sp,                             # color lines by species
                linetype = "Mixed (Fixed + Random)"),   # labeled in legend
            size = 0.8) +                               # thinner line for mixed effects

  geom_line(data = dataset,                             # plot fixed-effects predictions
            aes(x = height, y = pred_fixed, group = pft,# predictions by plant functional type (pft)
                color = pft,                            # color lines by deciduous/evergreen
                linetype = "Fixed Only"),               # labeled in legend
            size = 1.3) +                               # thicker line for fixed effects

  scale_linetype_manual(values = c("Fixed Only" = "solid",
                                   "Mixed (Fixed + Random)" = "dashed")) + # define line styles

  scale_color_manual(                                   # set color palettes
    values = c(
      setNames(turbo(length(unique(dataset$sp))), unique(dataset$sp)), # turbo palette for species
      deciduous = "brown", evergreen = "darkgreen"                     # custom colors for PFT
    )
  ) +

  theme_minimal() +                                     # clean theme
  labs(title = "Height vs Growth by Species", # plot title
       y = "Growth (mm/year)", x = "Height (m)",         # axis labels
       linetype = "Prediction Type",                     # legend for line types
       color = "Species / PFT") +                        # legend for species and PFT

  # Annotate fixed-effect equations directly on the plot
  annotate("text", x = 10,          # position text at right side
           y = 2.4,                # place near bottom
           label = "Deciduous: Growth = 0.124 + 0.051 × Height", # regression equation for deciduous
           color = "brown", hjust = 0, size = 4) +       # brown text for deciduous

  annotate("text", x = 10,          # position text at right side
           y = 2.5,                # place near top
           label = "Evergreen: Growth = (0.124 + 0.362) + 0.051 × Height", # regression equation for evergreen
           color = "darkgreen", hjust = 0, size = 4)     # green text for evergreen

print(p4) # plot the graphic 
3: Shiny App

This Shiny app lets you explore data, specify and fit linear mixed-effects models (LMMs),
check assumptions, and visualize fitted results—all without writing code.
It uses lme4/lmerTest for modeling and ggplot2 for graphics.

What you can do
- Load data: Use the built-in example or upload a CSV (the app auto-detects comma, semicolon, or tab separators).
- Build models: Choose a response, add fixed effects (with optional pairwise interactions), and pick a random-effects structure (random intercepts and/or slopes by a grouping factor).
- Inspect results: View the full
summary(), a readable interpretation, random-effects variability, and marginal/conditional R². - Diagnose assumptions: Residuals vs fitted, residual histogram with normal curve, Q–Q plot, Shapiro–Wilk normality test, and Levene’s variance homogeneity test.
- Visualize fits: Scatterplot of response vs predictor with dashed fitted lines by group (species/plot/etc.).
How it works (by tab)
-
Data Exploration
Preview the first rows and asummary()of your dataset. Make a histogram of any numeric variable (with density overlay, palettes viaviridis/“turbo”/gradient) and a scatterplot (optionally colored by a variable). This helps spot skew, outliers, or clusters before modeling. -
Model
Response: pick a numeric outcome (e.g.,growth).
Fixed effects:- Guided selection — choose one or more fixed terms; if “Include interactions” is checked, the app adds all pairwise interactions (e.g.,
a:b). - Custom formula — type a fixed-effects formula (e.g.,
height + pft + height:pft).
sp) and a structure: random intercept only(1 | group), intercept + slope (correlated or uncorrelated), or slope only. Click Fit Model to runlmer(). The app shows the model formula, the fullsummary(), and a dynamic explanation (fixed-effects direction & significance, random-effects variability, plus marginal/conditional R² fromperformance::r2()). For factors, R uses treatment (dummy) coding with the first level as the reference. - Guided selection — choose one or more fixed terms; if “Include interactions” is checked, the app adds all pairwise interactions (e.g.,
-
Diagnostics
Residuals vs fitted (equal-variance check), residual histogram with a normal curve, Q–Q plot (normality), Shapiro–Wilk test for residual normality, and Levene’s test for homogeneity across a categorical variable. Use these to verify model assumptions and spot patterns or outliers. -
Fitted Results
A scatterplot of response vs a key predictor (usesheightif present) with dashed fitted lines by group, plus the printed fixed effects (fixef()) and random effects (ranef()). A short interpretation panel explains what parallel vs diverging lines imply about slopes.
Practical tips
- Data formatting: Use a tidy CSV with clear column names. Convert grouping variables to factors in your data if possible.
- Reference levels: The reference level for factors is the first (alphabetical) by default. Reorder levels in your data if needed.
- Model structure: Random slopes require enough observations per group to estimate reliably; start with
(1 | group)and add complexity as justified. - Interpretation: Combine p-values with effect sizes and plots. Consider centering/scaling numeric predictors in your data before upload for easier interpretation (e.g., meaningful intercepts).
Under the hood
Packages: shiny, lme4, lmerTest, ggplot2, performance (R²), car (Levene),
viridis/viridisLite (palettes), readr.
4: Wrap Up
END of Workshop Script Key Takeaways:
Linear Mixed-Effects Models (LMMs) handle hierarchical data: Useful when data are grouped (e.g., trees within species, plots, or sites), capturing both fixed effects (population-level) and random effects (group-level).
Model selection is based on ANOVA comparisons: Allows testing which fixed and random effects improve the model. Parsimonious models (simpler but informative) are preferred.
Model diagnostics are essential: Residual plots check linearity and homoscedasticity, Shapiro-Wilk test and histograms assess normality, and Levene’s test checks homogeneity of variances.
R² interpretation for mixed models:
- Marginal R² = variance explained by fixed effects only.
- Conditional R² = variance explained by both fixed + random effects. This distinction shows the added contribution of random effects.
Visualization enhances interpretation: Scatterplots, residual plots, and fitted vs observed predictions clarify how fixed and random effects contribute to explaining variation.
Practical insight: In this example, both tree height and plant functional type (PFT: deciduous vs evergreen) were informative predictors of tree growth, while random effects captured species-specific deviations around these general trends. —
5. References and Evaluation Survey
References
- Bates, D., Mächler, M., Bolker, B., & Walker, S. (2015). Fitting linear mixed-effects models using lme4. Journal of Statistical Software, 67(1), 1–48. https://doi.org/10.18637/jss.v067.i01
- McGill, B. (2015). Is it a fixed or random effect? Dynamic Ecology (blog). View post
- Winter, B. (2013). Linear models and linear mixed effects models in R with linguistic applications. arXiv:1308.5499. https://arxiv.org/abs/1308.5499
- Yates, F. (1935). Complex experiments. Journal of the Royal Statistical Society. Supplement, 2(2), 181–247.
- Zuur, A. F., Ieno, E. N., Walker, N. J., Saveliev, A. A., & Smith, G. M. (2009). Mixed effects models and extensions in ecology with R. Springer.